Loading... > 本文详细介绍了如何使用`blackbox.yaml`配置文件在Kubernetes中部署blackbox_exporter,包括使用ConfigMap挂载配置、创建Deployment、Service,以及添加自定义的scrape_configs以监控特定服务和DNS服务器。 **实验案例:监控个人博客站点** ## 一、blackbox\_exporter应用场景 - HTTP 测试: 定义 Request Header 信息、判断 Http status / Http Respones Header / - Http Body 内容 - TCP 测试: 业务组件端口状态监听、应用层协议定义与监听 - ICMP 测试: 主机探活机制 - POST 测试: 接口联通性 - SSL证书过期时间 ### 1.1 创建以下文件 ```shell [root@k8s-master01 blackbox]# ll 总用量 12 -rw-r--r-- 1 root root 1514 5月 5 19:42 blackbox_configmac.yaml -rw-r--r-- 1 root root 695 5月 5 19:50 blackbox-deployment.yaml -rw-r--r-- 1 root root 249 5月 5 19:51 blackbox-service.yaml ``` ### 1.2 编写blackbox_configmac.yaml ```shell [root@k8s-master01 blackbox]# cat blackbox_configmac.yaml apiVersion: v1 kind: ConfigMap metadata: name: blackbox-external-config namespace: monitor-sa data: config.yml: |- "modules": "http_2xx": "prober": "http" "timeout": "5s" "http": "valid_http_versions": ["HTTP/1.1", "HTTP/2"] "valid_status_codes": [] "method": "GET" "preferred_ip_protocol": "ip4" "fail_if_ssl": flase "fail_if_not_ssl": flase "http_2xx_3xx": "prober": "http" "timeout": "5s" "http": "valid_http_versions": ["HTTP/1.1", "HTTP/2"] "valid_status_codes": [ 200, 201, 202, 203, 204, 205, 206, 207, 208, 226, 300, 301, 302, 303, 304, 305, 306, 307, 308 ] "method": "GET" "preferred_ip_protocol": "ip4" "fail_if_ssl": flase "fail_if_not_ssl": flase "http_post_2xx_3xx": "prober": "http" "timeout": "5s" "http": "valid_http_versions": ["HTTP/1.1", "HTTP/2"] "valid_status_codes": [ 200, 201, 202, 203, 204, 205, 206, 207, 208, 226, 300, 301, 302, 303, 304, 305, 306, 307, 308 ] "method": "POST" "preferred_ip_protocol": "ip4" "fail_if_ssl": flase "fail_if_not_ssl": flase "tcp_connect": "prober": "tcp" "timeout": "5s" "tcp": "preferred_ip_protocol": "ip4" "icmp": "prober": "icmp" "timeout": "5s" "icmp": "preferred_ip_protocol": "ip4" ``` ### 1.3 编写blackbox-deployment.yaml ``` [root@k8s-master01 blackbox]# cat blackbox-deployment.yaml apiVersion: apps/v1 kind: Deployment metadata: name: blackbox-external namespace: monitor-sa spec: replicas: 1 selector: matchLabels: app: blackbox-external template: metadata: labels: app: blackbox-external spec: containers: - name: blackbox-exporter image: bitnami/blackbox-exporter:latest ports: - containerPort: 9115 volumeMounts: - name: config-volume mountPath: /etc/blackbox_exporter/ # 正确位置:volumes在Pod模板的spec下 volumes: - name: config-volume configMap: name: blackbox-external-config # 确保ConfigMap已存在且名称匹配 ``` ### 1.4 编写blackbox-service.yaml ```shell [root@k8s-master01 blackbox]# cat blackbox-service.yaml apiVersion: v1 kind: Service metadata: name: blackbox-external namespace: monitor-sa spec: selector: app: blackbox-external ports: - name: http protocol: TCP port: 9115 targetPort: 9115 nodePort: 30115 type: NodePort ``` ## 二、配置prometheus 以及 rules告警规则 ### 2.1 配置prometheus ```shell - job_name: 'blackbox-urls' metrics_path: /probe # 相对于job_name缩进2空格 params: module: - http_2xx static_configs: - targets: # static_configs是列表,需以"-"开头并缩进 - http://www.hxy.bj.cn # 监控url - http://heyan666.ddns.net:88 relabel_configs: - source_labels: [__address__] target_label: __param_target - source_labels: [__param_target] target_label: instance - target_label: __address__ replacement: 100.100.157.12:30115 ### blackbox url\prot ``` ### 2.2 配置rules ```shell - name: blackbox-监控告警 rules: - alert: Web站点url监控 expr: probe_http_status_code{job="blackbox-urls"} != 200 for: 15s labels: severity: critical annotations: summary: "网站不可达,请检查: {{ $labels.instance }}" ``` ## 三、测试 > 以个人站点为例,将站点nginx stop 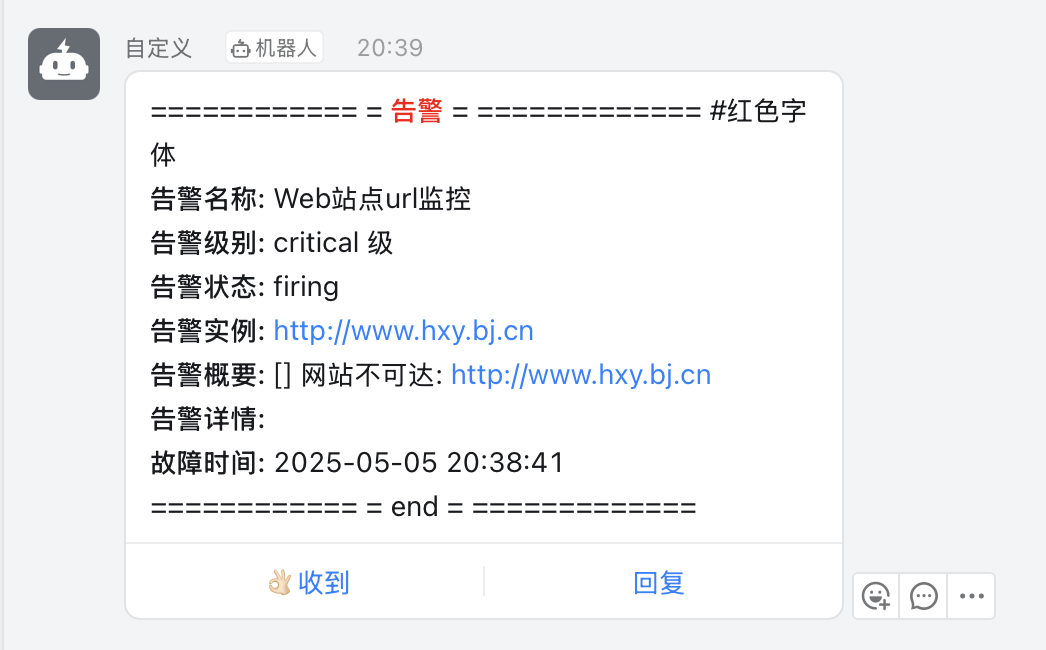 ## 四、配置grafana blackbox 监控可视化页面 [grafana模版链接](https://grafana.com/grafana/dashboards/9965-1-blackbox-exporter-dashboard-20220412/) 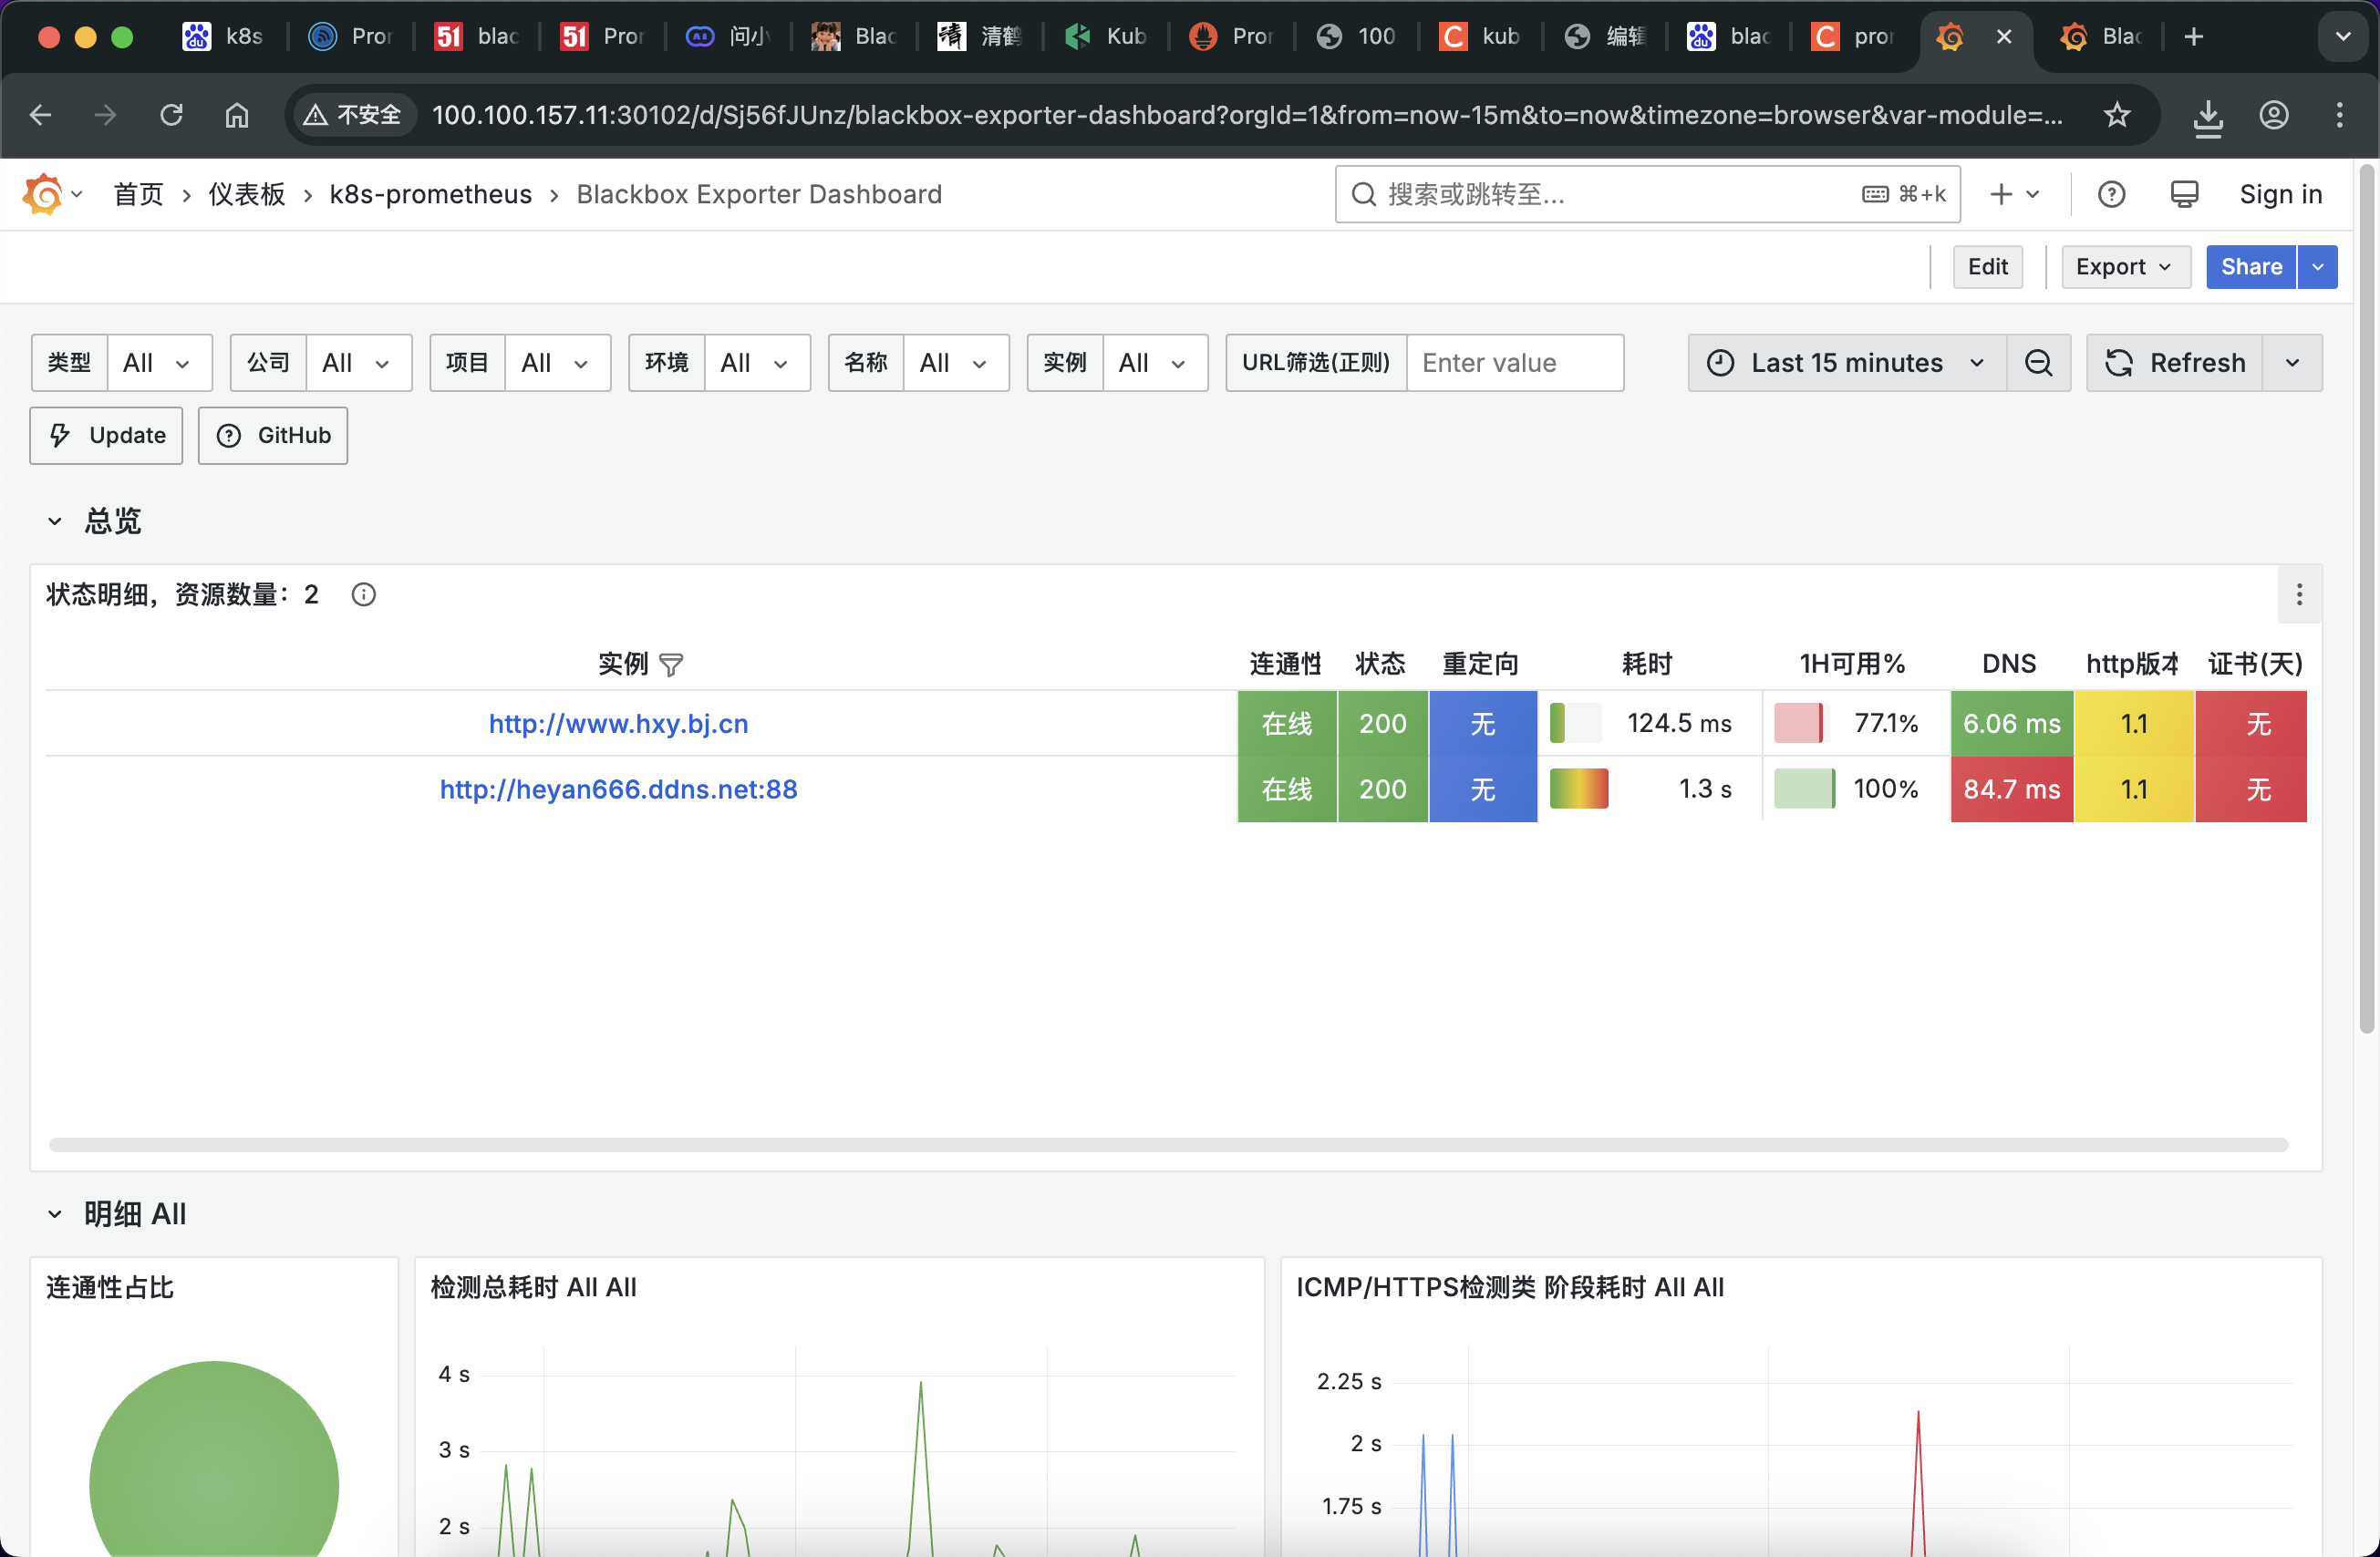 最后修改:2025 年 05 月 05 日 © 允许规范转载 打赏 赞赏作者 支付宝微信 赞 2 如果觉得我的文章对你有用,请随意赞赏
